Using Mermaid to create Diagrams
Published
In a previous article, we generated the skeleton of a procedurally generated story. In this case, as in many other it’s nice to get a visual output instead of lines upon lines of text, which is why I wanted to introduce Mermaid.
Mermaid is a markdown-like language which allows generating a wide selection of charts and diagrams and we’ll be using it to generate a flow chart of our knowledge base.
The simplest example in Mermaid is the flow chart. It starts by graph TD, then you can declare nodes and edges using ”—>“.
graph TD
node_1 --> node_2
node_2 --> node_3
node_1 --> node_3
See? Very simple to declare a graph. Let’s see how it looks with a more complex chart. We’ll use the python code below to parse the knowledge base from the procedural story article and generate a flow chart.
with open("story-data.pl", "r") as f:
data = f.readlines()
subset = []
for elem in data:
if len(elem) < 4:
continue
if elem[:4] == "edge":
subset.append(elem)
for i in range(len(subset)):
subset[i] = subset[i].replace("edge(", "")
subset[i] = subset[i].replace(").\n", "")
subset[i] = subset[i].replace("). \n", "")
subset[i] = subset[i].split(", ")
output = ["graph TD"]
for elem in subset:
output.append(elem[0] + " --> " + elem[1])
with open("output.txt", "w+") as f:
for line in output:
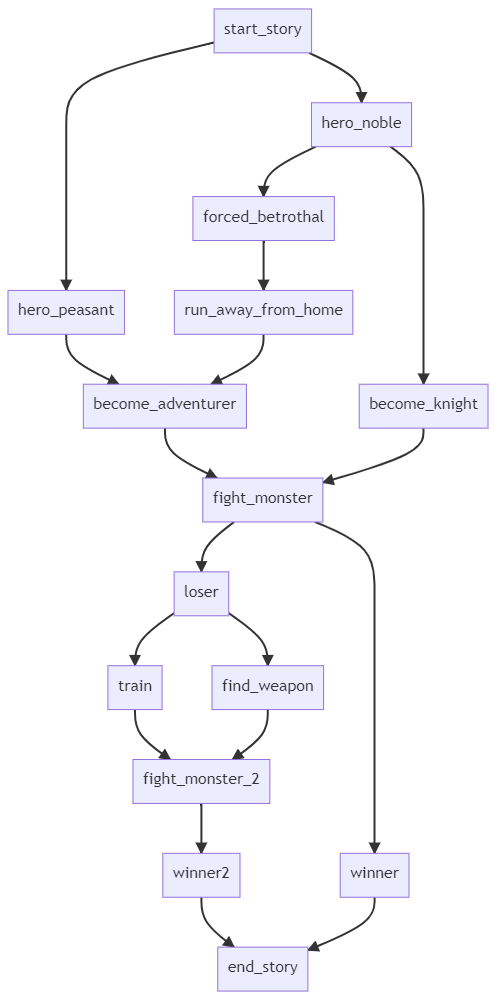
f.write(f"{line}\n")Thanks to our code we now get a valid mermaid flowchart definition.
graph TD
start_story --> hero_noble
start_story --> hero_peasant
hero_noble --> forced_betrothal
forced_betrothal --> run_away_from_home
hero_noble --> become_knight
hero_peasant --> become_adventurer
run_away_from_home --> become_adventurer
become_adventurer --> fight_monster
become_knight --> fight_monster
fight_monster --> winner
fight_monster --> loser
loser --> train
loser --> find_weapon
train --> fight_monster_2
find_weapon --> fight_monster_2
fight_monster_2 --> winner2
winner2 --> end_story
winner --> end_story
Now, we could set up a js project and import mermaid as a dependency, but for ease of use we’ll just use the Mermaid Live Editor.
Here’s the result. Pretty neat right? The Live Editor allows you to export your chart as a png or svg.
The Live Editor also contains sample code for other type of diagrams, so go crazy and try it out!